Measuring digital marketing campaigns for a nonprofit organization can be a daunting task. You want to first begin with the key performance indicators that are important to your organization. I have listed six website measurements that should be a starting point in your analytics process. If you are using an analytics program like Google Analytics or Matomo {formerly Piwki}, these programs will number crunch for you.
Remember, analysis is not only understanding the data, but asking deeper questions. Once you get a more advance understanding of the analytics program, you can customize to get more relevant information. You can amass a ton of data, but here are a few core metrics to get your started.
The first goal of digital marketing is understanding how to better engage users with the organization’s website to meet your organizations goals. Before you begin with the measurement process, define and outline 3-5 goals, you want to achieve with a digital marketing campaign. Make sure the goals are clearly defined, quantifiable, not generic, adaptable, and actionable. Setting goals early in the process allow you to measure conversion rates more effectively. Goals have three parts: a time-frame, objectives, and a metric you hope to achieve.
The second step is to list all of the key performance indicators that are important to your nonprofit organization. Then you can determine how to measure your campaigns.
Number of Visitors
Analytics programs won’t be spot on with the number of visitor’s to your website. Visitors could opt out of analytics programs within their web browser. But don’t get discouraged! Usually, the number of visitor’s recorded in most analytics programs are around 95-99% accurate.
Measuring your server log files are a more accurate way to measure your real visitor count. But this requires a little bit of advance knowledge. Tools are available to measure server log files, but that’s not part of this post.
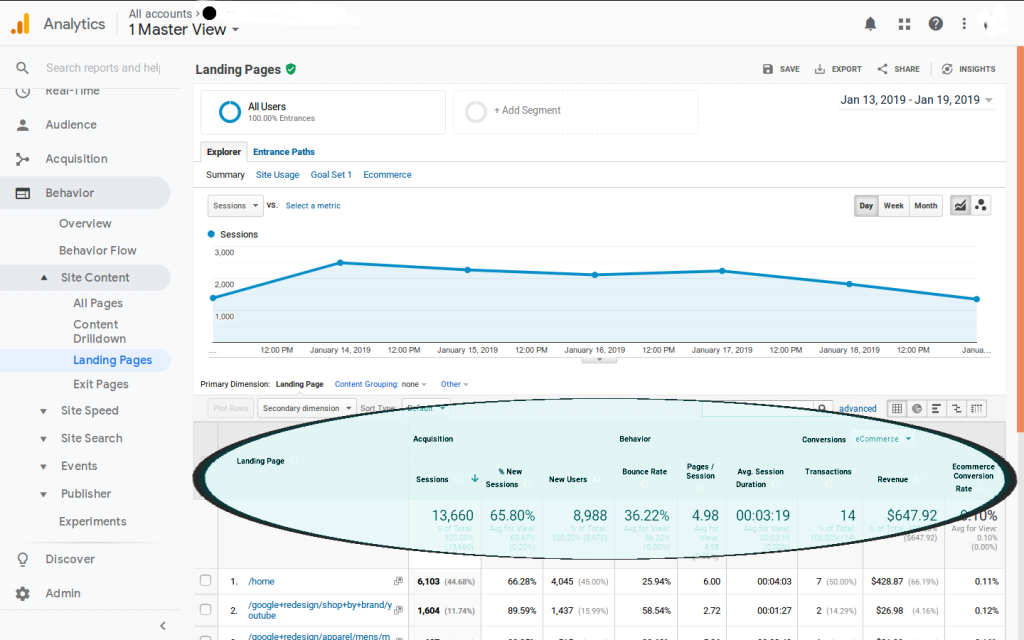
In Google Analytics Users and Sessions are the two metrics you want to review. See the image below in the highlighted circle.
Duration
How long are people staying on your website? Are they staying 30 seconds, an hour or more? Depending on the type of content on your website, duration could be an excellent measurement to determine if visitor’s are finding what they were looking for.
In Google Analytics you can review the Average Session Duration.

Bounce Rate
Bounce rate is the percentage of of visitors that visited your site and only visited one page. A high bounce rate means visitors probably did not find the content they were searching for.
Page Views
Page views offer a wealth of information to gauge how well your website’s content is performing. In Google Analytics, you can view page bounce rates and average time on page. If a page has a high bounce rate, investigate why the page has a high bounce rate. Are the keywords relevant to the page content, does the page take too long to load.
Conversions
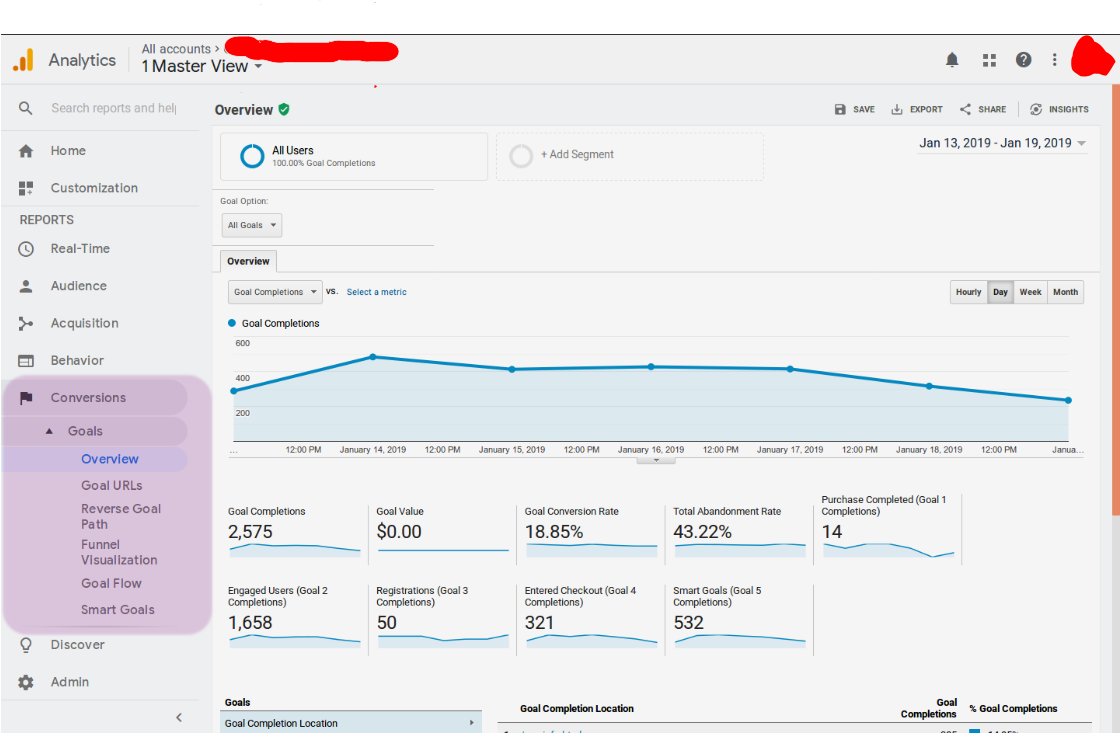
Conversions are actions taken on your website. You have set goals and those goals should lead to visitor’s performing some action. A conversion could be:
An email sign up, watched a video for a certain length of time, purchased items in your ecommerce store, made a donation, filled out a form on your website (contact, survey, submitted a ticket, etc), visited the site for certain time (site duration).

Return on Investment (ROI) (e-Commerce & Fundraising)
Return on Investment (ROI) is a performance measure used to evaluate the efficiency of an investment in your advertising campaigns or compare the efficiency of a number of different advertising campaigns. ROI tries to directly measure the amount of return on an particular investment, relative to the investment’s cost.
Calculate your Google Ad ROI by first gathering data such as cost to produce the product. Then look at your total cost to advertise the product, event, or lead. Finally with the right information in hand you can compare your digital advertising campaigns to better understand the value of leads generated or product sold.
ROI is measured by taking the revenue that resulted from your ads, subtract your overall costs, then divide by your overall costs:
The return on investment formula:
ROI (%)= (Gain from Investment – Cost of Investment) / Cost of Investment
OR
ROI (%) = (Revenue – Cost of goods sold) / Cost of goods sold
This should get you started on tracking and assessing your Google Analytics data.
Concluding Advice:
Begin with small goals and then work towards larger goals. Also don’t get so caught up in the numbers. Use the numbers as a way to begin problem solving. That’s the way to build better digital marketing campaigns. Web analytics programs have a ton of advance metrics you can use. But understanding how to implement the intermediate and advance features Google Analytics offers requires patience, time, and a lot of research. Take small baby steps, then move to the larger more complex data.
